
Download the PDF version of this article
The Conservation Display ratings in the Aardenburg Imaging lightfastness testing database indicate the range of acceptable light exposure to which prints can be subjected and still remain in very good to excellent overall condition.
Why is each Conservation Display Rating expressed as a range?
The viewer’s ability to observe changes in the color and tonal accuracy of an image is dependent not only on the fading behavior of the chosen print process but also on the image-specific colors and tones in each print. Simply stated, for any given printing process certain prints will reveal noticeable fading sooner (ie., with less light exposure)than others due to their image-specific distribution of colors and tones.
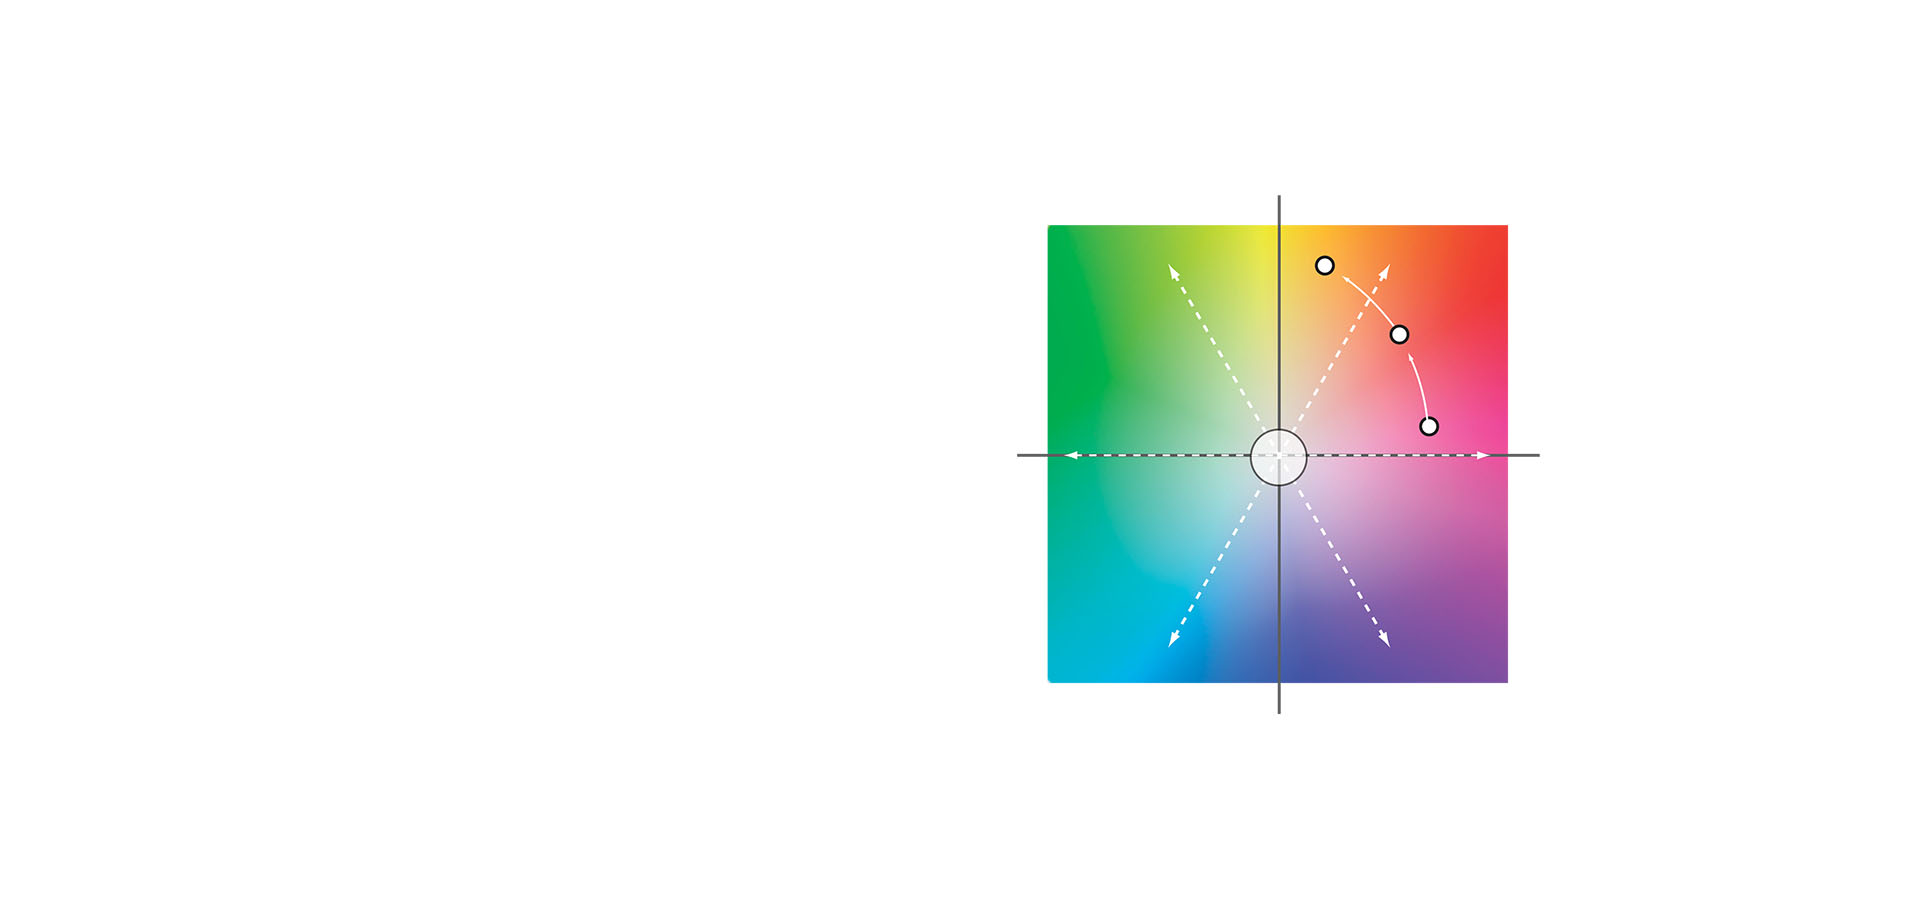
Various print processes or “systems” comprising the printer, colorants, media, etc., have different inherent weaknesses. Sometimes a system’s pattern of color fading is very selective, and the system exhibits large differences in the amount of light needed to initiate fading of the weakest colors versus the amount of light needed to initiate the fading of the majority of the colors. We can call this system attribute “SELECTIVE” fading. On the other hand, sometimes the system’s pattern of fading is more uniform overall, because the weakest colors are only marginally weaker than any other colors. The system will begin to exhibit the first signs of fading over most of the image area rather than just in selective parts of the image where the weakest colors are located. We can call this system attribute “GLOBAL” fading. The occurrence of selective fading is becoming more of a signature pattern with modern inkjet prints compared to traditional silver halide color prints due in large part to their multi-colorant ink blending technologies used to form the coherent photographic image. Selective fading is also promoted by the wide choice of inkjet media that can interact chemically and physically with the inks. A classic example of media‑influenced selective fading is the inclusion of optical brighteners which may fade prematurely and cause selective color changes preferentially in the highlight areas of the print.
How do we define and identify acceptable fading in a photograph?
When a system has stongly selective color fading behavior, prints with dominant image areas of “average” colors and tones can still appear to be in acceptable condition well beyond the exposure level where the weakest colors may have reached their acceptable limits of fade. This important attribute of system performance requires that we identify an upper‑bounding exposure value where all colors are likely to have reached their acceptable levels of fade, and also the lower‑bounding exposure value where just a small portion of the colors are likely to have reached their acceptable levels of fade. Hence, we must choose ALLOWABLE LIMITS to prevent fading from exceeding visual criteria for ACCEPTABLE CHANGE. We must also use a testing methodology and a general-purpose test target that identifies and scores the system on changes in both selective and global color accuracy which meet but do not exceed the allowable limits. The criteria for allowable change must track distributions of colors and tone and not merely fail the system entirely on the “worst” single color value which may or may not even appear in some prints. Table I shows the Conservation Display Rating Criteria Set used by Aardenburg Imaging & Archives to rate imaging systems on both their selective and global patterns of fade.
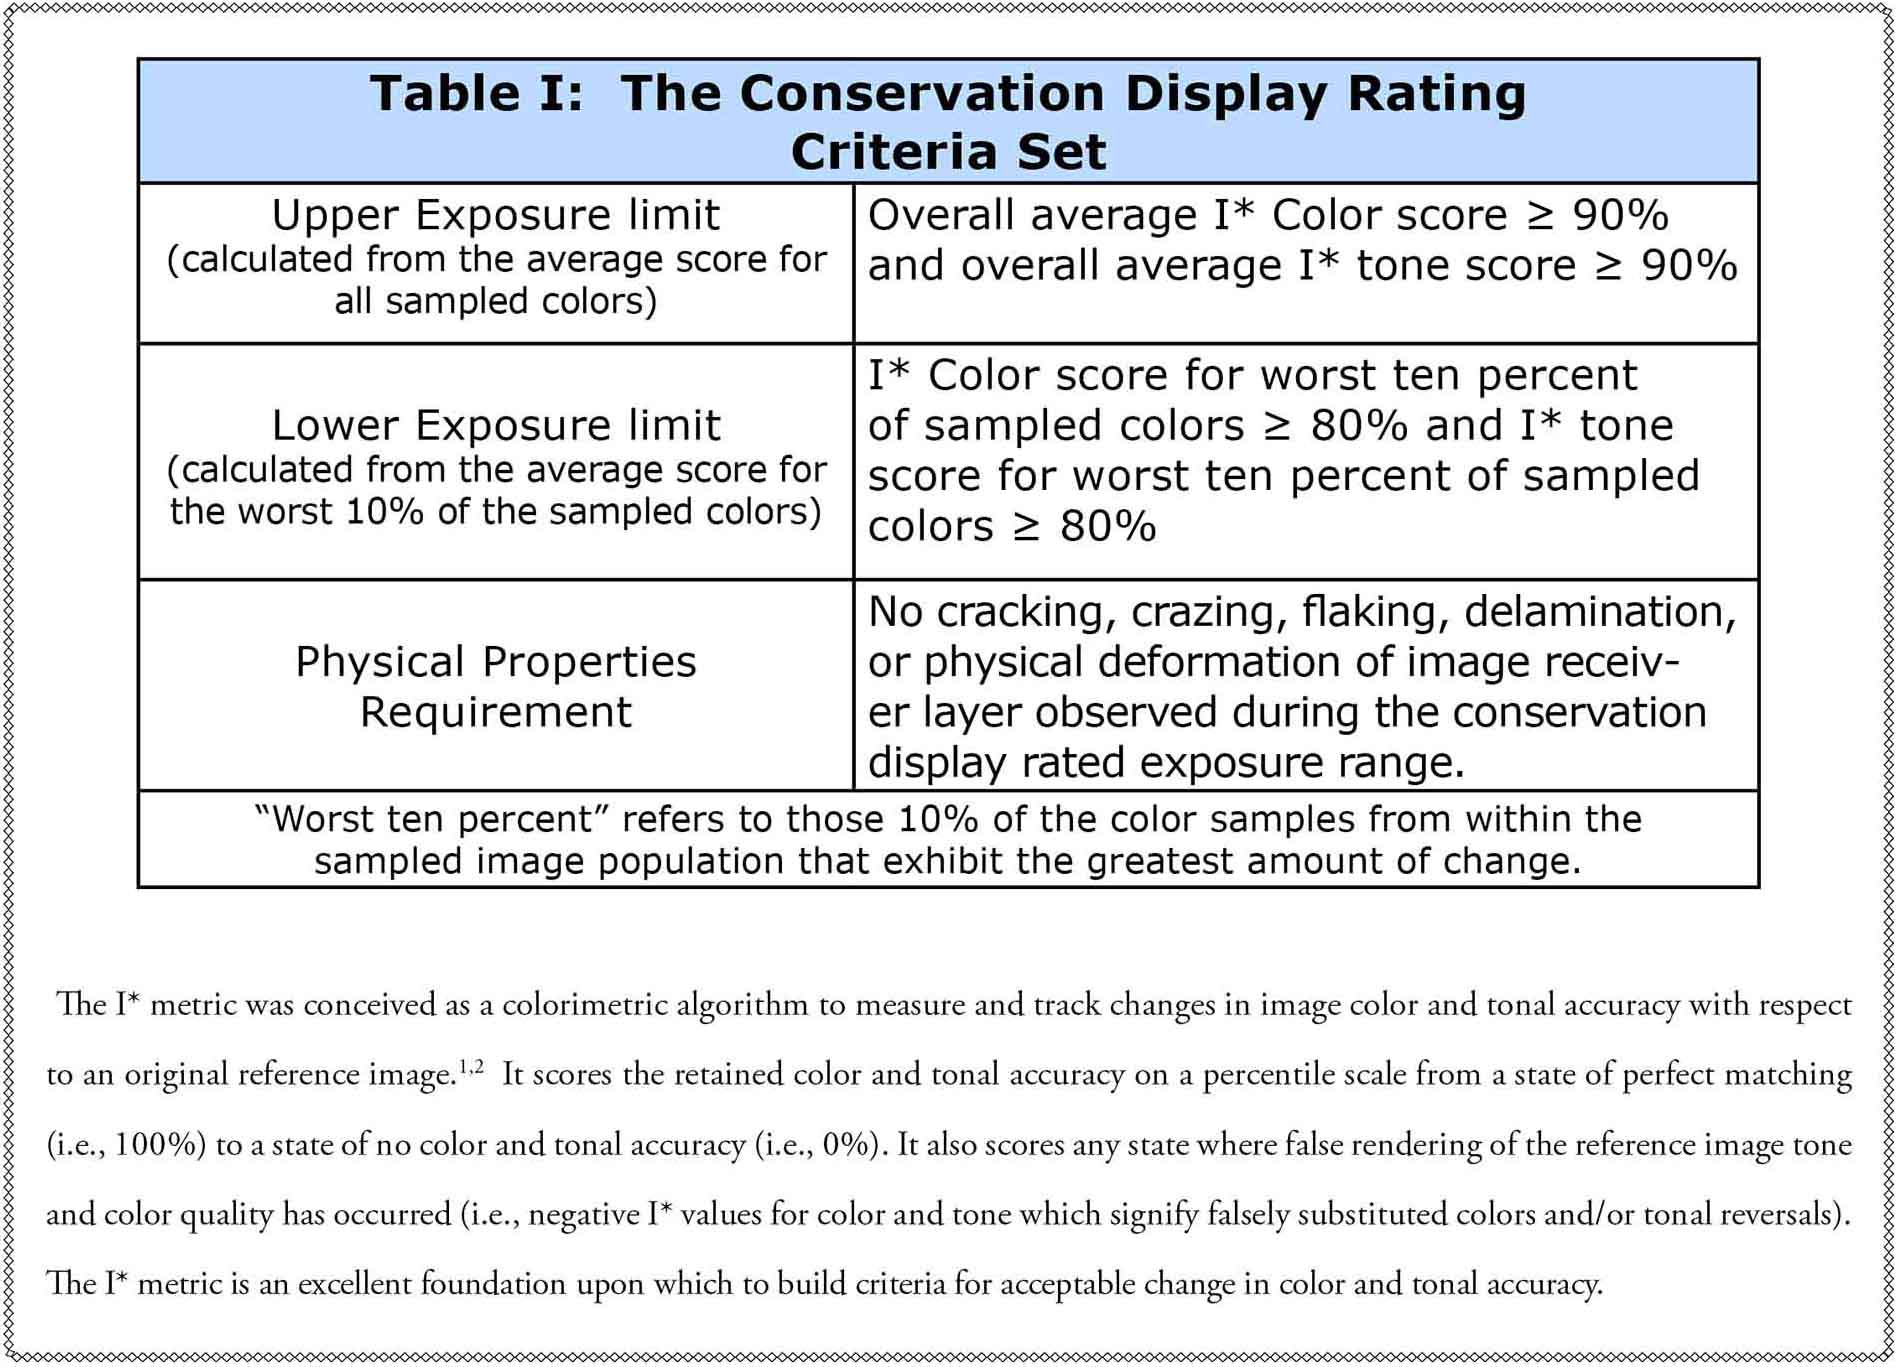
The conservation display rating criteria shown above were chosen deliberately to limit the amount of “acceptable” fading to very tight tolerances for color and tonal accuracy retention based on both “worst case” and “average” color fading performance. Prints containing colors and tones which reveal selective fading system behavior will remain in excellent condition at the rated exposure dose calculated from the lower exposure limit criterion. Prints with dominant colors and tones exhibiting more average overall fading response will also remain in excellent condition at the rated lower exposure limit but may also tolerate up to the higher rated exposure dose calculated by the upper exposure limit criterion. Thus, the conservation display rating provides guidance on the range of exposures over which different prints, depending on image-specific content, may remain in excellent condition.
How do Conservation Display ratings differ from consumer photo “Display life” ratings
Conservation Display ratings differ from the traditional consumer photo-oriented display life ratings because:
1) They are expressed in terms of exposure dose (i.e., megalux-hours) rather than “years on display”.
2) They offer conservation guidance and “apples-to-apples” system comparisons based on the early stages of light‑induced deterioration where a print still remains in excellent condition. In contrast, consumer photo display life ratings attempt to predict mid-to-late stages of deterioration where fading is easily noticeable and often objectionable.
3) They identify the critical range of exposures rather than a single value required to induce potentially “just noticeable” fading. Whether any noticeable fading is actually observed by the viewer depends on specific image content and also on whether the viewer is judging the print in critical side-by-side viewing conditions with a print in perfect original condition. In all cases the changes estimated by the conservation display criteria are subtle, and the prints should be perceived to retain very good to excellent color and tonal accuracy when compared to their original unexposed and unfaded state.
4) The exposure range information reported by the conservation display rating qualifies the total system performance of different printing processes more fairly. Whereas some prints, depending on image content, may only tolerate the exposure represented by the low end of the range, other prints will tolerate the higher exposure value represented by the high end of the range and still appear to be in excellent condition. For two systems with identical lower limit exposure scores, prints made on the system with the higher upper limit exposure score will on average retain their excellent condition longer (i.e., tolerate a higher exposure dose).
Can the Megalux-hour exposure values be converted to “Years on Display?”
Yes. As many photographers know, the reciprocity law states that EXPOSURE = INTENSITY × TIME. If we know what average intensity exists in the display environment (i.e., the illumination level expressed photometrically in Lux units) we can calculate the time needed to achieve the exposure doses predicted by the Conservation Display rating.
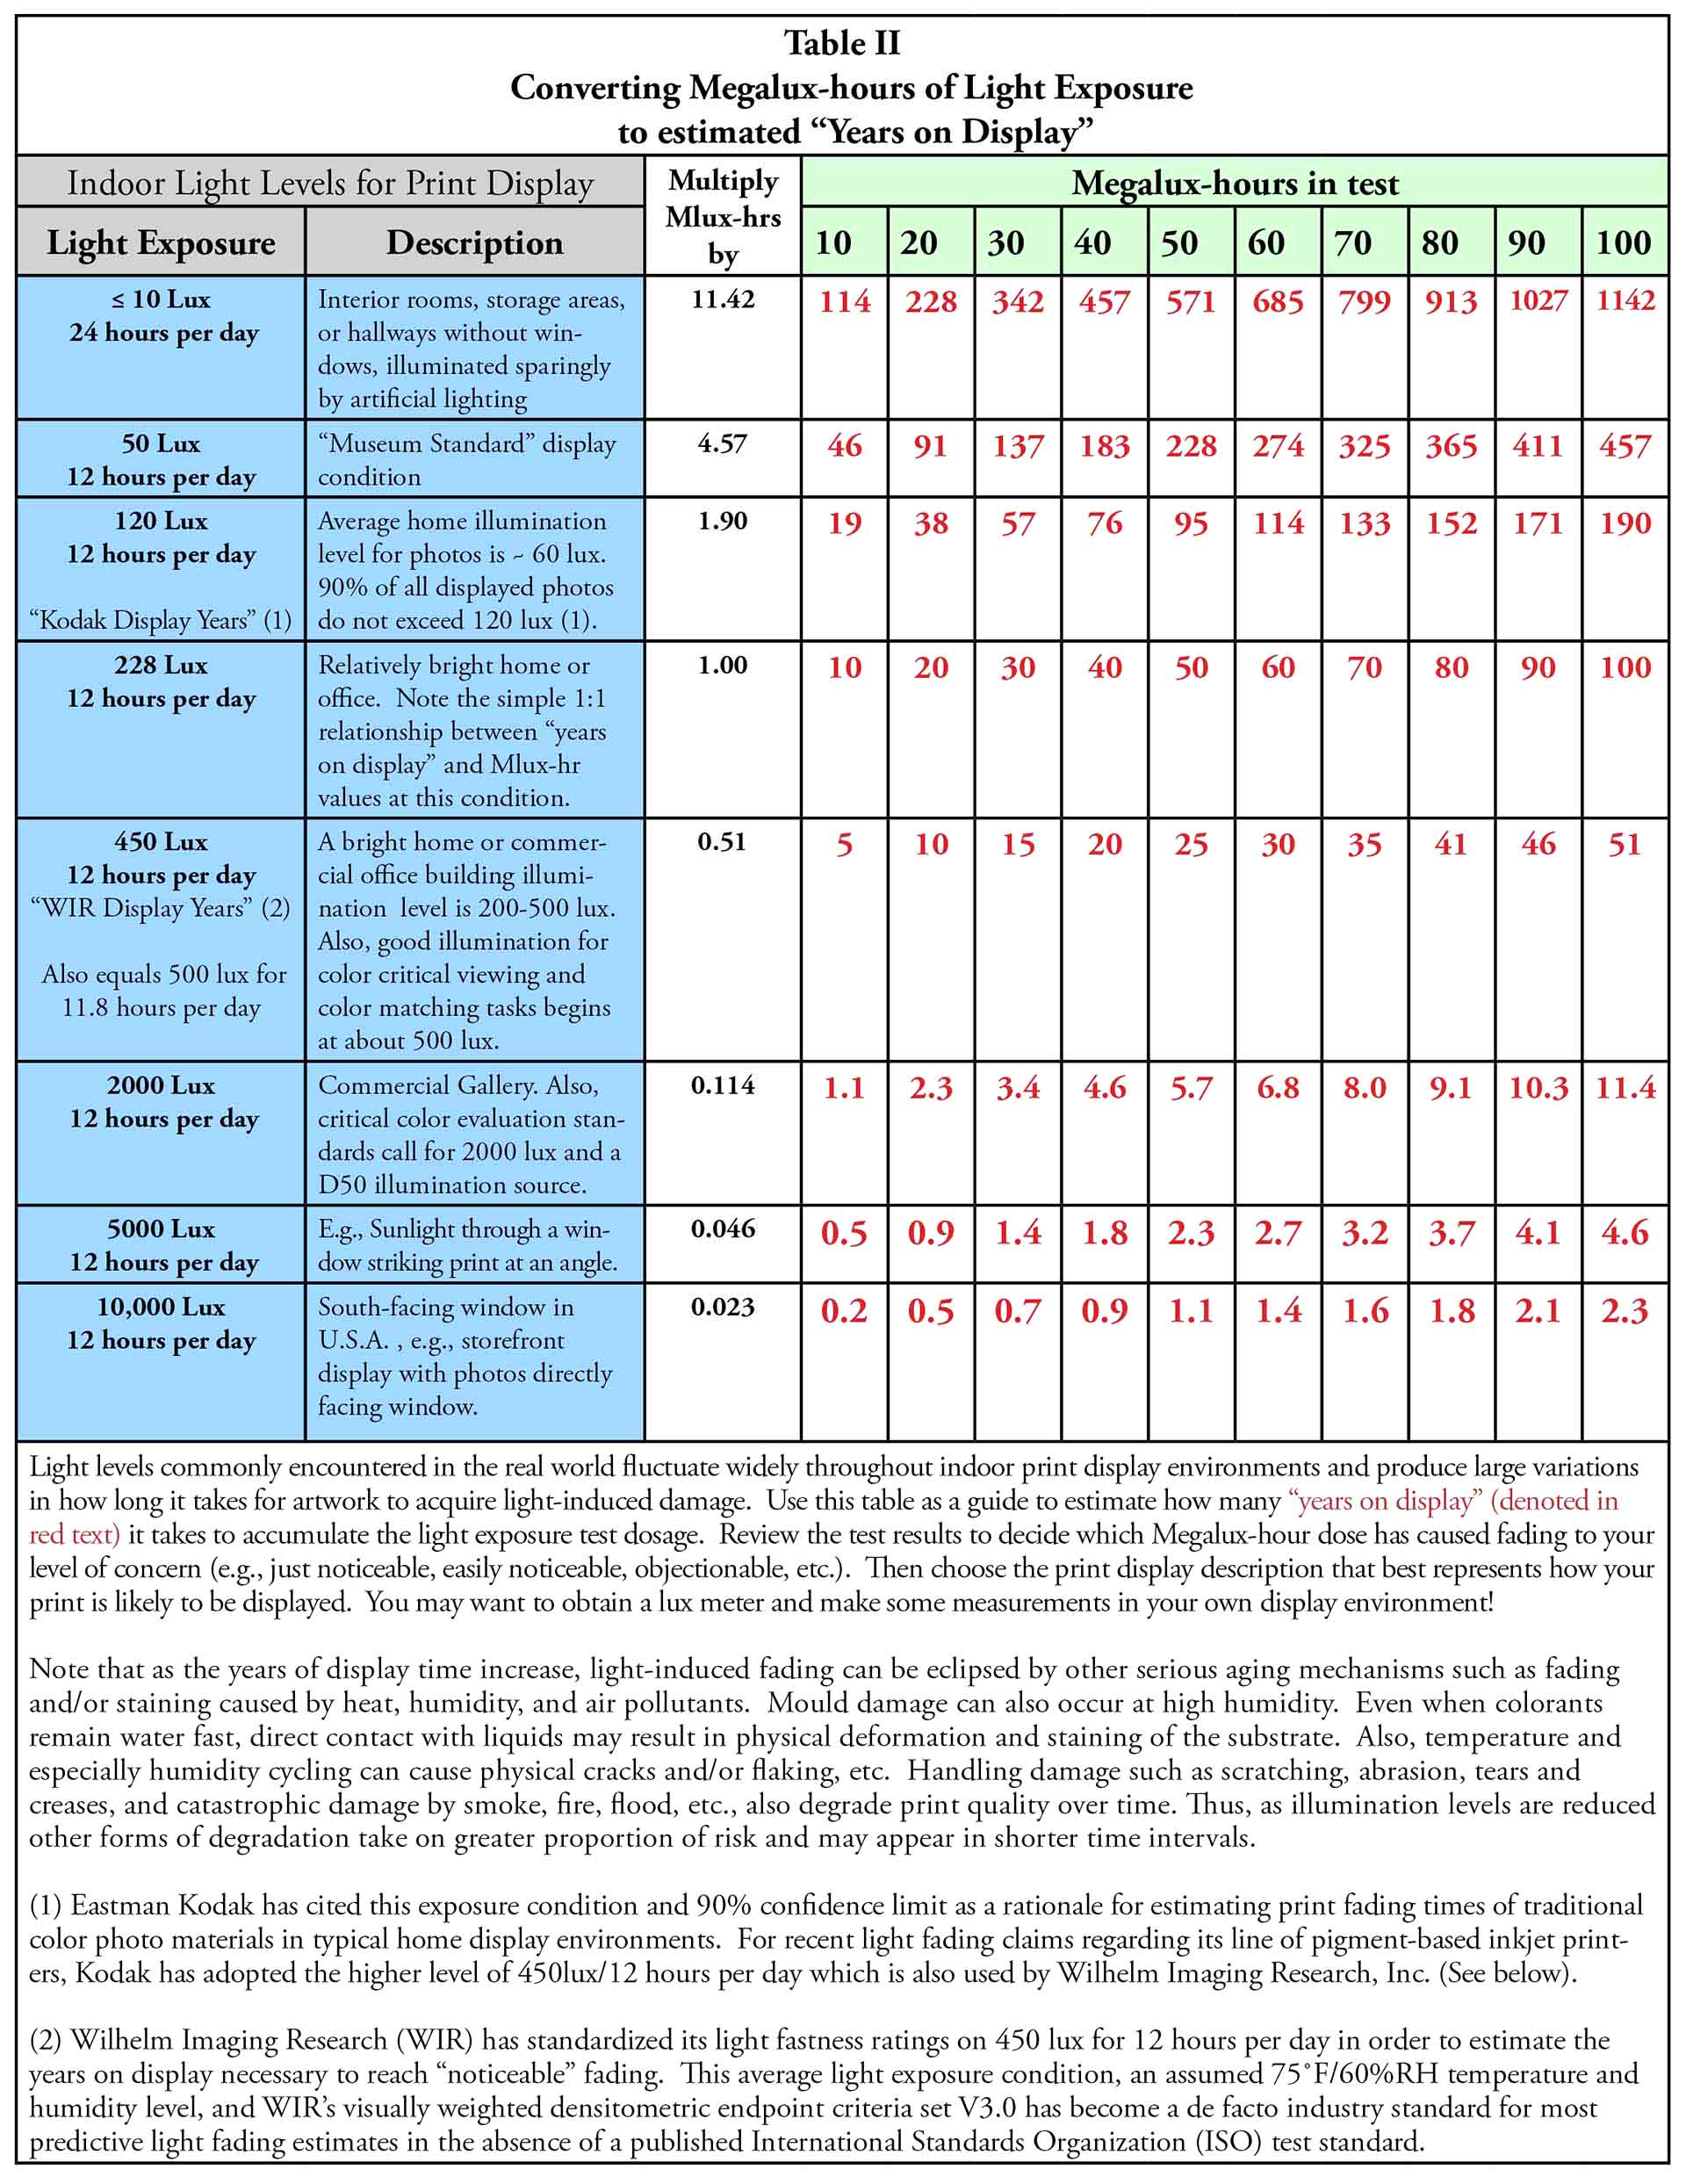
Average print illumination levels vary by orders of magnitude in the real world. The collector, curator, or conservation specialist is in a far better position to decide how a particular print is going to be displayed than is the scientist in the laboratory. With appropriate knowledge of print illumination levels, the “Years on Display” needed to reach the allowable exposure limits can be easily calculated. Table II provides an easy guideline for estimating “Years on Display” derived from Conservation Display ratings. If average illumination levels are actually measured with a lux meter, then the reciprocity law can be used to make an even more accurate assessment of time on display.
Note: A very simple rule of thumb to relate Conservation Display ratings to industry-standardized“years on display” is to divide the Megalux‑hour values by 2. This simple relationship between megalux-hours and years on display uses the widely cited industry‑standard assumption of average display illumination levels equal to 450 lux for 12 hours per day.
Illustrative Examples on the Interpretation of Conservation Display Ratings
Consider the following three inkjet systems:
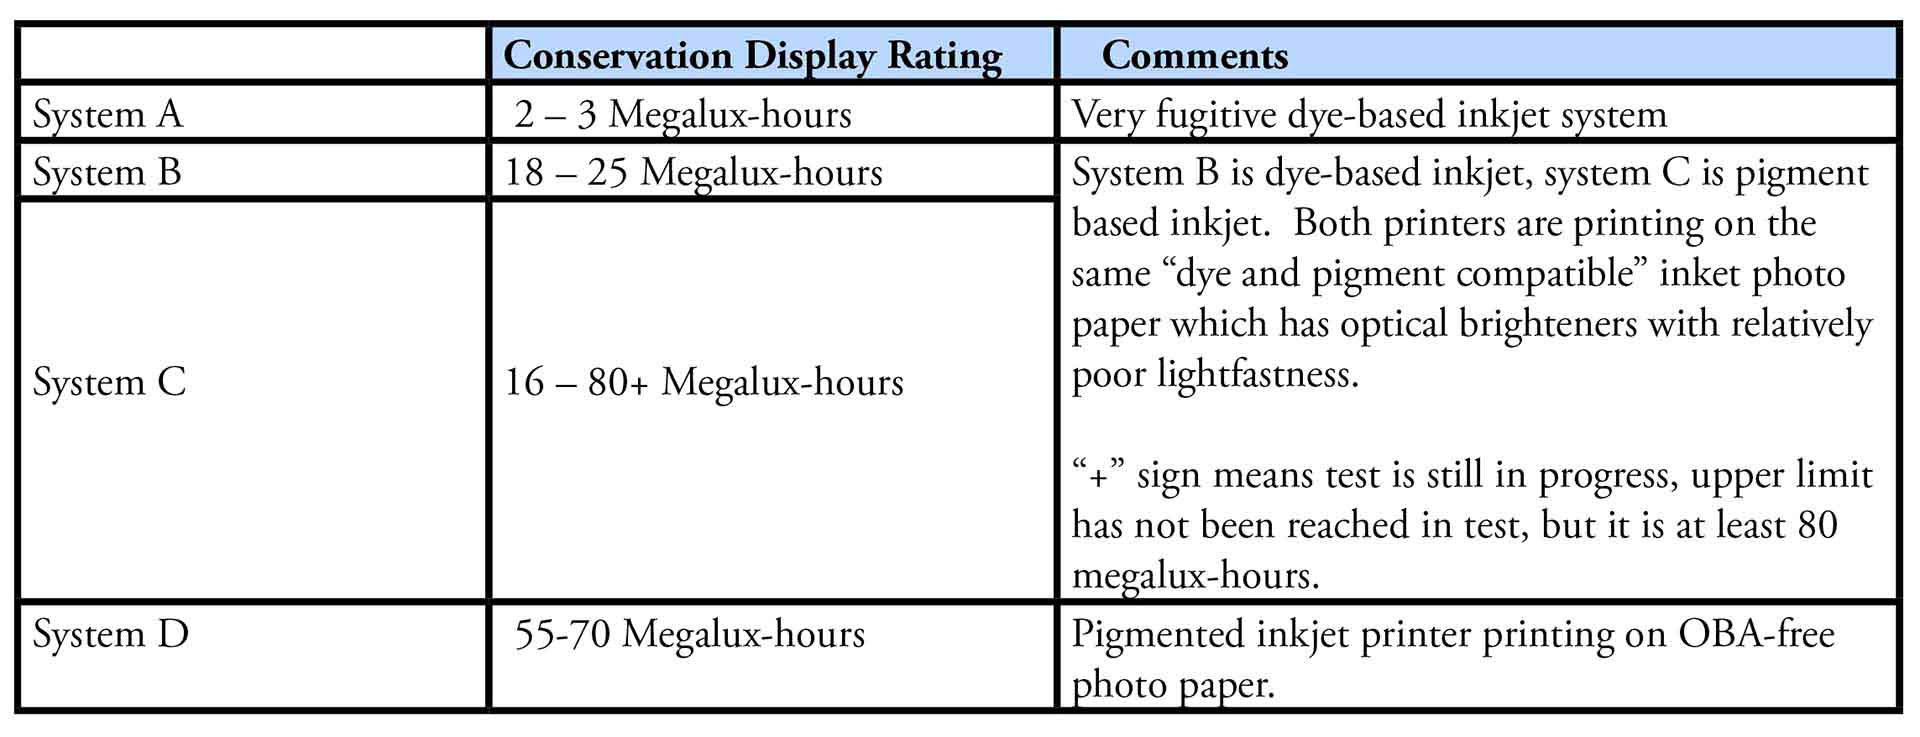
System A retains excellent color and tonal fidelity only for a very limited amount of light exposure. Almost all colors and tones in any prints made on this system begin to change in a narrow range of exposures (2-3 megalux‑hours). The narrow exposure range signifies that this is an example of a system with little selective fading and much global fading.
System B and System C printers made prints on the same brand of inkjet paper. The paper is marketed as both “dye and pigment compatible”, and it contains relatively fugitive optical brighteners. The eventual loss of fluorescence is the weak link in both systems and causes subtle yet just noticeable paper “yellowing”. The loss of optical brightener activity thus affects paper color and image highlights on both systems B and C but to slightly varying degrees which account for the small differences in the lower boundary of the Conservation Display rated exposure range.
The pigmented colors of system C are much more lightfast than system B dyes, and the rating at the upper exposure value limit attests to the clear overall superiority of system C . Its Conservation Display rating would likely be much better on other papers, but it has been reduced by the inherent selective color weakness caused by the choice of inkjet paper. The small discrepancy in lower exposure limit scores which actually favors system B over C is caused by additional yellow dye loss in system B that isn’t occurring in the more stable pigments of system C at this point in test. The slight loss of yellow dye in some highlight colors and the subsequent subtle shift towards blue is offsetting the OBA “yellowing” during the early stages of light fading in system B. This situation gives the perhaps surprising result of improving system B’s lower limit exposure boundary somewhat compared to system C.
Lastly, System D has a much higher value for the lower exposure limit than the other systems. It is therefore arguably the most stable system of the four, but depending on image content, some prints made on system C may retain excellent image fidelity even longer than some made on system D because the upper exposure limit for system C exceeds that of system D. When lower limits are significantly better on one system than another, regardless of upper limits, the wise choice for media selection is to choose the one that helps to achieve a better lower limit, but be aware that higher upper limits do indicate at least some image-specific content will retain color fidelity longer on the system with higher upper limits.
It is possible to use the I* metric and customized test targets that sample image-specific colors and tones to make a more precise determination of unique print performance than can be achieved with general-purpose test targets. This approach may be very worthwhile for museums and galleries electing to purchase or sell expensive contemporary works where the artist’s choice of digital printing process can and probably should be thoroughly documented.
References
1) Mark McCormick-Goodhart, Henry Wilhelm, and Dmitriy Shklyarov,“A ‘Retained Image Appearance’ Metric For Full Tonal Scale, Colorimetric Evaluation of Photographic Image Stability,” IS&T’s NIP20: International Conference on Digital Printing Technologies, Final Program and Proceedings, IS&T, Springfield, VA, October 3–November 5, 2004, pp. 680–688.
2) Mark H. McCormick-Goodhart, “An Introduction to the I* Metric,” Aardenburg Imaging & Archives, February 7, 2007
About the Author
Mark McCormick-Goodhart is the founder and Director of Aardenburg Imaging & Archives. He has over thirty years of professional experience in imaging and materials science and holds eight U.S. patents in the field of imaging science and technology. He has also published over 30 papers related to imaging science and photographic conservation. Photography and printmaking has been his special interest for over forty years. From 1988 to 1998, he was the Senior Research Photographic Scientist at the Smithsonian Institution in Washington, DC. In 1996, Mark co-founded one of the first fully color-managed digital fine art printing studios, Old Town Editions, in Alexandria, Virginia with colleague Chris Foley. From 1998-2005, Mark collaborated with Henry Wilhelm of Wilhelm Imaging Research, Inc. to develop new image permanence test methods for evaluating modern digital print media. Since founding Aardenburg Imaging in 2007 to begin industry testing using the i* metric, Mark has established the most advanced light fade testing program in the industry by adhering to the highest testing standards in a direct relationship with the printmaking community.

